赵瑞琳团队亮点文章:野生食用菌“苇菇”的物种多样性及中华美味蘑菇适生区预测
Doi: 10.13346/j.mycosystema.210233
野生食用菌“苇菇”的物种多样性及中华美味蘑菇适生区预测
曹槟1,林汝楷2,刘冬梅3*,赵瑞琳1,4*
1 中国科学院微生物研究所真菌学国家重点实验室,北京 100101
2 三明市食用菌技术推广站,福建 三明 365000
3 中国环境科学研究院生态研究所,北京 100012
4 中国科学院大学生命科学学院,北京 101408
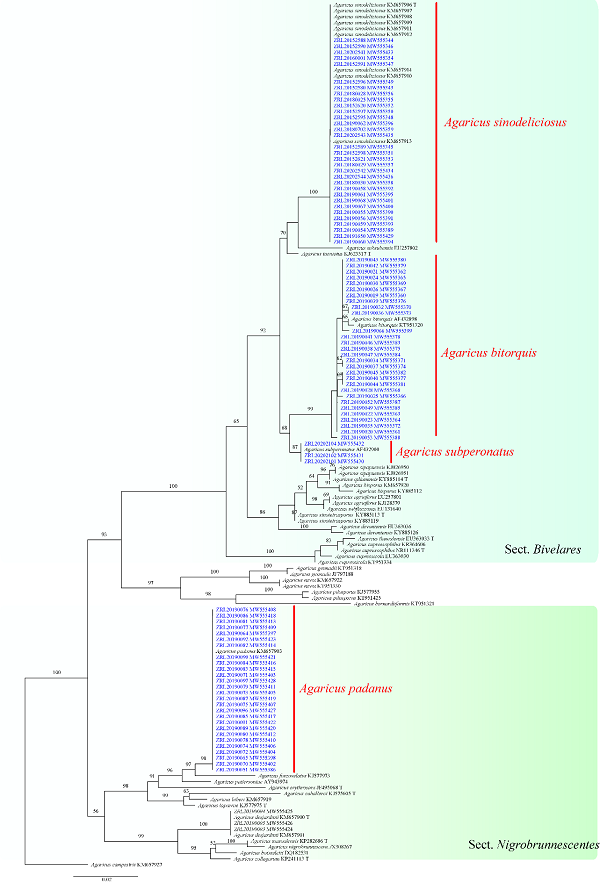
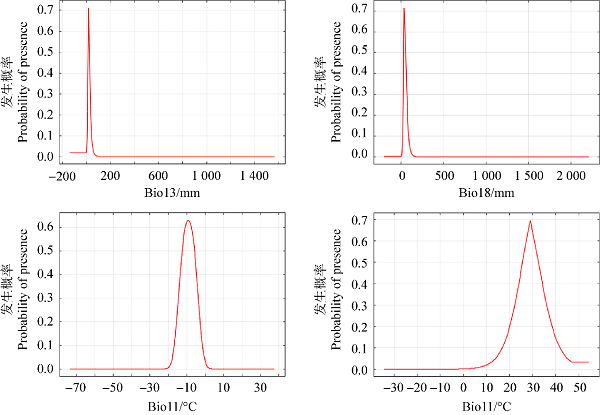
摘 要:“苇菇”是主产于新疆的野生食用菌,主要分布于我国西北内陆湖泊周边的芦苇或多枝柽柳林内,埋生或半埋生在土壤中。本研究共采集和收集相关标本91份,开展了形态学和分子系统学研究,结果表明这些宏观形态特征相似的“苇菇”标本并非一个物种,而是分属于蘑菇属Bivelares组的大肥蘑菇Agaricus bitorquis、中华美味蘑菇A. sinodeliciosus和亚托柄蘑菇A. subperonatus;及Nigrobrunnescentes组的帕达纳蘑菇A. padanus。本文对“苇菇”形态进行了描述,并提供了它们的分种检索表。其中大肥蘑菇、亚托柄蘑菇和帕达纳蘑菇在我国和欧洲等地均有分布,而中华美味蘑菇仅在我国有报道。据此,依据1950–2000年生物气候数据结合中华美味蘑菇的分布实地调查结果,利用最大熵模型(maximum entropy model,MaxEnt)开展了对中华美味蘑菇分布区的分析和预测,结果表明中华美味蘑菇适生区在我国主要为新疆天山山脉南北两侧、西藏西南部、青海海西州、甘肃西北部以及内蒙古西部地区;预测国外适生区域在中亚的哈萨克斯坦和蒙古国。物种分布模型涉及的环境变量对模型的贡献率显示,最湿月降水量、最暖季度降水量、最冷季度平均温度和最暖月最高温是影响中华美味蘑菇分布的主要环境因子。研究结果表明中华美味蘑菇适生区域狭窄,为狭域种,建议应加强相关资源的保护,并积极拓展其可持续利用途径以降低对野生中华美味蘑菇子实体的过度消耗。
关键词:蘑菇属;系统发育;最大熵模型

图1 基于ITS序列构建的蘑菇属Pseudochitonia亚属系统发育树(BS≥50)
Fig. 1 Phylogenetic tree of Agaricus subgenus Pseudochitonia based on ITS (BS≥50).

图2 “苇菇”子实体宏观形态图 A:子实体埋生;B:大肥蘑菇;C:中华美味蘑菇;D:亚托柄蘑菇;E:帕达纳蘑菇 标尺=2 cm
Fig. 2 Basidiomes. A: Buried furit bodies; B: Agaricus bitorquis; C: A. sinodeliciosus; D: A. subperonatus; E: A. padanus. Bars=2 cm.

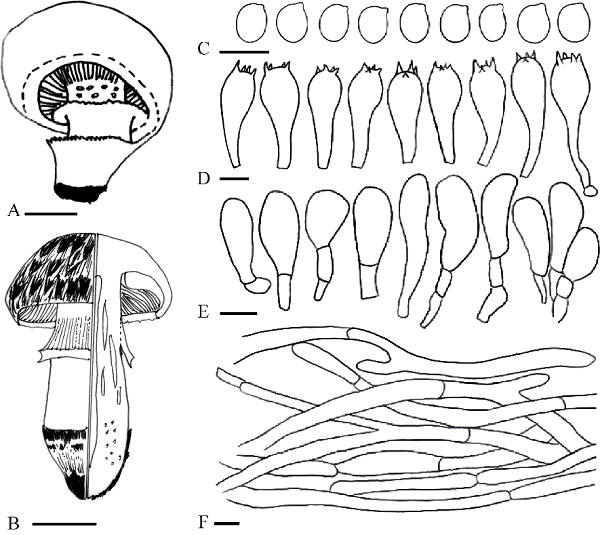
图3 “苇菇”的关键形态特征 A:大肥蘑菇(菌环从下向上发育,开口向上,靴状);B:亚托柄蘑菇(菌环从上向下发育,开口向下,裙状);C:担孢子形态;D:担子形态;E:褶缘囊体形态;F:菌盖表皮菌丝形态. 标尺:A,B=2cm,C–F=10μm. A和B参考Parra (2008)
Fig. 3 Key characteristics of ‘reed mushrooms’. A: Agaricus bitorquis (Annulus inferous); B: A. subperonatus (Annulus superous); C: Basidiospores; D: Basidia; E: Cheilocystidia; F: Pileipellis hyphae. Bars: A, B=2 cm, C–F=10 μm. A and B were redrawn by referring to Parra 2008.

审图号:GS(2021)6081号
图4 基于MaxEnt模型预测中华美味蘑菇的适生区
Fig. 4 Potential distribution regions of Agaricus sinodeliciosus.
表1 物种分布模型涉及的环境变量及其对模型的贡献率
Table 1 Environmental variables used to create the species distribution model and their percentage contribution to model performance
| 编号 Code | 环境变量 Environmental variable | 贡献率 Contribution (%) |
| Bio1 | 年均温Annual mean temperature | 1 |
| Bio2 | 昼夜温差月均值Mean diurnal range | 0.5 |
| Bio3 | 等温性Isothermality | 3.3 |
| Bio4 | 温度季节性变化的标准差Temperature seasonality | 0 |
| Bio5 | 最暖月最高温Max. temperature of warmest month | 15.4 |
| Bio6 | 最冷月最低温Min. temperature of coldest month | 1 |
| Bio7 | 年均温变化范围Temperature annual range | 0.2 |
| Bio8 | 最湿季度平均温度Mean temperature of wettest quarter | 0 |
| Bio9 | 最干季度平均温度Mean temperature of driest quarter | 0 |
| Bio10 | 最暖季度平均温度Mean temperature of warmest quarter | 0 |
| Bio11 | 最冷季度平均温度Mean temperature of coldest quarter | 16.5 |
| Bio12 | 年均降水量Annual precipitation | 0 |
| Bio13 | 最湿月降水量Precipitation of wettest month | 40 |
| Bio14 | 最干月降水量Precipitation of driest month | 2.2 |
| Bio15 | 降水量变异系数Precipitation seasonality | 0.6 |
| Bio16 | 最湿季度降水量Precipitation of wettest quarter | 0 |
| Bio17 | 最干季度降水量Precipitation of driest quarter | 1.1 |
| Bio18 | 最暖季度降水量Precipitation of warmest quarter | 16.9 |
| Bio19 | 最冷季度降水量Precipitation of coldest quarter | 1.3 |

图5 主要气候因子的响应曲线
Fig. 5 Response curves of main climate factors.


 京公网安备 11010502044263号